Investor Relations
| Financial Indicators | (Excel:14KB) |
| 2020 | 2021 | 2022 | 2023 | 2024 (Plan) |
|
|---|---|---|---|---|---|
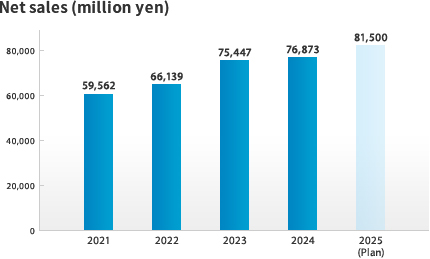
| Net sales (million yen) | 60,599 | 59,562 | 66,139 | 75,447 | 78,000 |
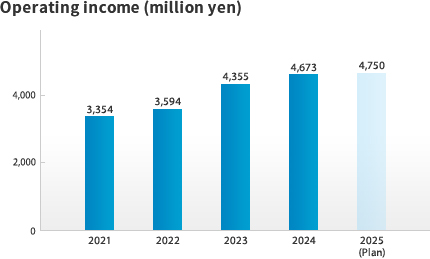
| Operating income (million yen) | 4,085 | 3,354 | 3,594 | 4,355 | 4,500 |
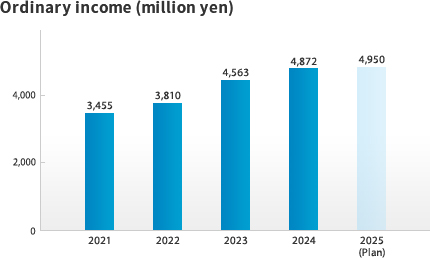
| Ordinary income (million yen) | 4,177 | 3,455 | 3,810 | 4,563 | 4,700 |
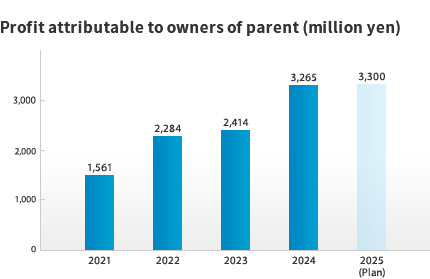
| Profit attributable to owners of parent (million yen) | 2,875 | 1,561 | 2,284 | 2,414 | 2,900 |
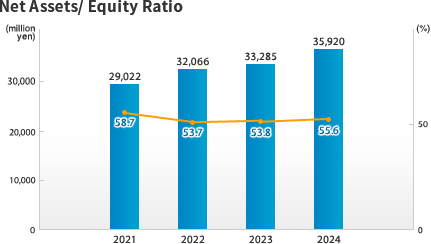
| Net assets (million yen) | 28,387 | 29,022 | 32,066 | 33,285 | - |
| Equity ratio | 61.2% | 58.7% | 53.7% | 53.8% | - |
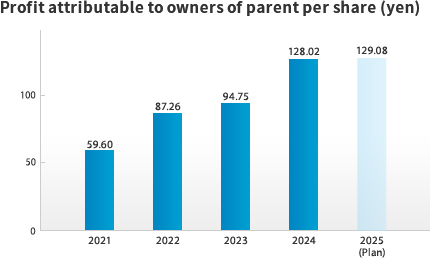
| profit attributable to owners of parent per share (yen) | 107.46 | 59.60 | 87.26 | 94.75 | 113.68 |
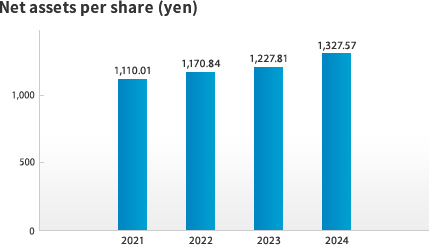
| Net assets per share (yen) | 1,071.09 | 1,110.01 | 1,170.84 | 1,227.81 | - |
Net sales
Income
Net Assets/ Equity Ratio
Profit attributable to owners of parent per share / Net assets per share