Investor Relations
| Financial Indicators | (Excel:14KB) |
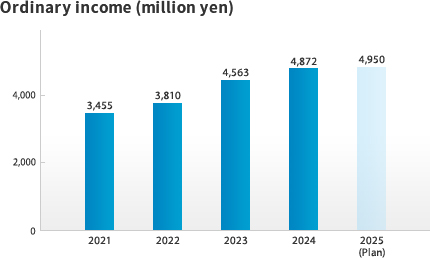
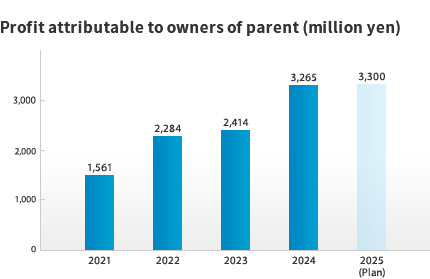
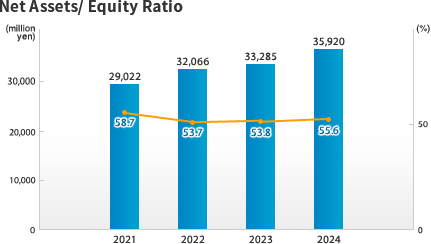
| 2023 | 2024 | 2025 | 2026 | 2027 (Plan) |
|
|---|---|---|---|---|---|
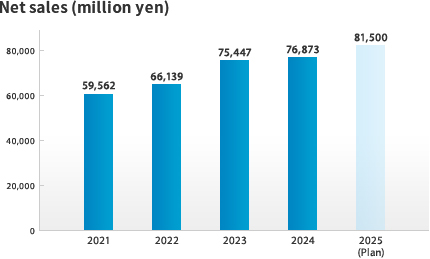
| Net sales (million yen) | 75,447 | 76,873 | 79,175 | 83,949 | 91,000 |
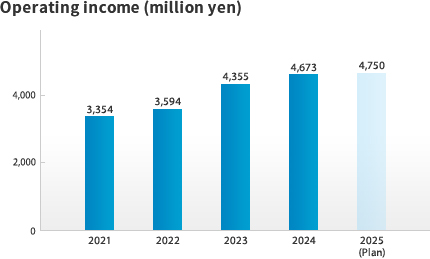
| Operating profit (million yen) | 4,355 | 4,673 | 4,465 | 4,644 | 4,950 |
| Ordinary profit (million yen) | 4,563 | 4,872 | 4,679 | 4,851 | 5,150 |
| Profit attributable to owners of parent (million yen) | 2,414 | 3,265 | 3,272 | 3,302 | 3,400 |
| Net assets (million yen) | 33,285 | 35,920 | 38,350 | 40,566 | - |
| Equity ratio | 53.8% | 55.6% | 55.7% | 55.7% | - |
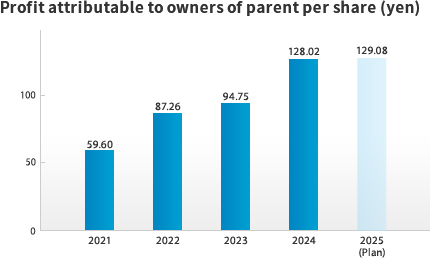
| profit attributable to owners of parent per share (yen) | 94.75 | 128.02 | 128.02 | 128.95 | 132.63 |
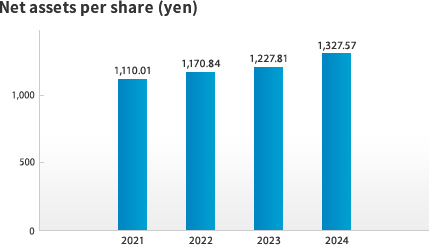
| Net assets per share (yen) | 1,227.81 | 1,327.57 | 1,419.62 | 1,503.22 | - |
Net sales
Income
Net Assets/ Equity Ratio
Profit attributable to owners of parent per share / Net assets per share